Explore
Walk through the product, stage by stage.
Five stages with one connected fictional dataset — the fund you inspect is the one the forecast describes, the portfolio holds, the scenario stresses and the explanation covers.
Fictional experience — preset demonstration data. No real market data, no live model, and nothing here describes a real instrument, portfolio or result.
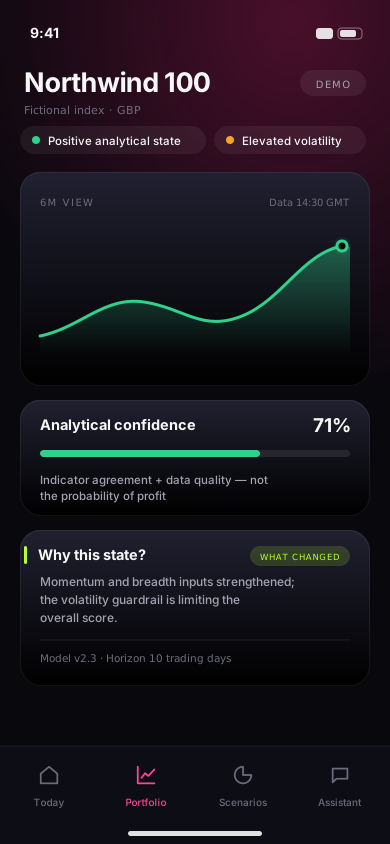
Instrument context
- Instrument
- Northwind 100 (fictional index fund)
- Price
- 8,214 · GBP
- Analytical state
- Positive · elevated volatility
- Trend / momentum
- Above 50-day average · momentum easing
- Volume
- Above its 20-day average
- What it says
- The Northwind 100 — a fictional equity index fund — with its recent price and volume behaviour: trend, momentum, volatility and volume, each computed from the price series itself.
- How to read it
- Start with the timestamp, not the chart. Every figure describes the market as it stood at the stated time; the analytical state ('positive, elevated volatility') summarises observed behaviour, not an opinion.
- What it does not mean
- Technical conditions describe what prices did, not why they did it, and say nothing about what they will do next.
A forecast, in full
- Defined event
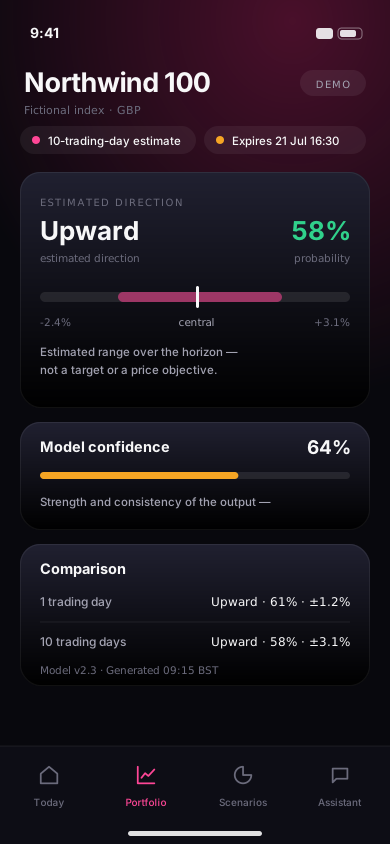
- Northwind 100 closes higher in 10 trading days
- Model probability
- 0.54
- Model-estimated range
- −4.2% to +6.8%
- Strength indicator
- Shown in the product; methodology to be published
- Main contributors
- 20-day realised volatility · momentum · volume trend
- What it says
- Over the next ten trading days, the model estimates a 0.54 probability for the defined event — the Northwind 100 closing higher than today — with a model-estimated range of −4.2% to +6.8%.
- How to read it
- Read the three parts together. The probability is the model's estimate for one defined event; the range is where the model places plausible outcomes; the strength indicator is a product-specific marker whose methodology will define it. Then read the expiry — after it, this output is history, not analysis.
- What it does not mean
- 0.54 is not the probability of making money, the range is not a prediction interval with a stated coverage level, and neither is a recommendation to act.
What it means for a portfolio
- Portfolio total
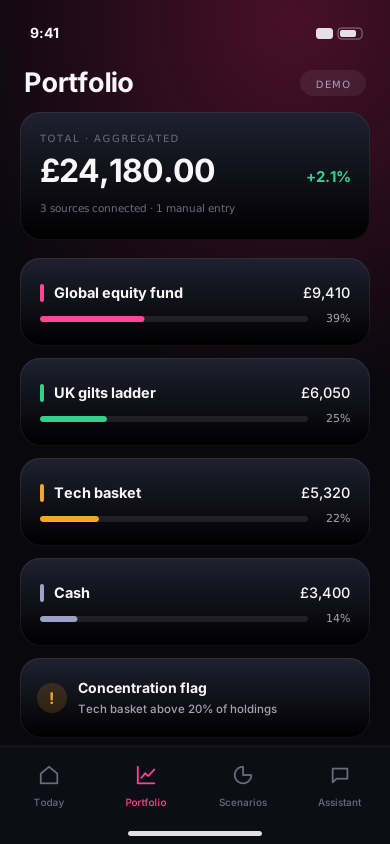
- £24,000 (fictional)
- This holding
- £7,200 · 30% of portfolio
- Trading currency
- USD
- Valuation currency
- GBP
- Concentration
- Largest single holding: 40% (UK equity fund)
- What it says
- A fictional £24,000 GBP portfolio holds £7,200 of the Northwind 100 — 30% of its value, and its largest foreign-currency exposure at the fund level.
- How to read it
- The split matters more than the total: 30% in one holding is a concentration fact, and a USD-priced holding means the exchange rate is part of the GBP result whether or not the fund moves.
- What it does not mean
- Currency exposure is measured at the level of the holding, not of what a fund owns inside it. No figure here says whether an allocation is right for anyone.
Test an assumption
- Assumption
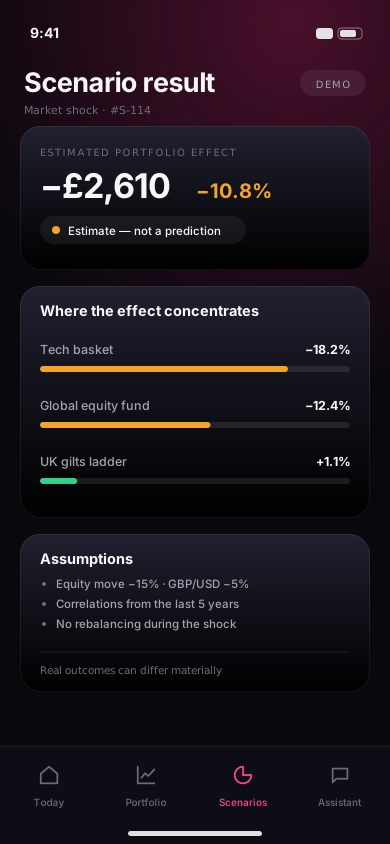
- Northwind 100 −10%, own currency, FX unchanged
- Class
- Mechanical (arithmetic)
- Holding before → after
- £7,200 → £6,480
- Portfolio before → after
- £24,000 → £23,280 (−3.0%)
- Currency effect
- None — the assumption holds FX at 1.275 USD/GBP
- What it says
- A mechanical scenario: if the Northwind 100 fell 10% in its own currency, this portfolio's stake falls from £7,200 to £6,480 — the total from £24,000 to £23,280, a 3.0% fall.
- How to read it
- Check the class first. This one is mechanical — pure arithmetic from stated prices, FX and holdings, reproducible exactly. A rates, volatility or macro stress would be an estimate from a model, and the product labels it as one.
- What it does not mean
- Scenarios come in two kinds. Mechanical scenarios are recalculated arithmetically and are deterministic only when the holdings, prices, exchange rates, assumptions and timestamps are all fully defined. Model-based stress scenarios rest on modelling assumptions and are not deterministic. Running one says nothing about whether the assumption will happen.
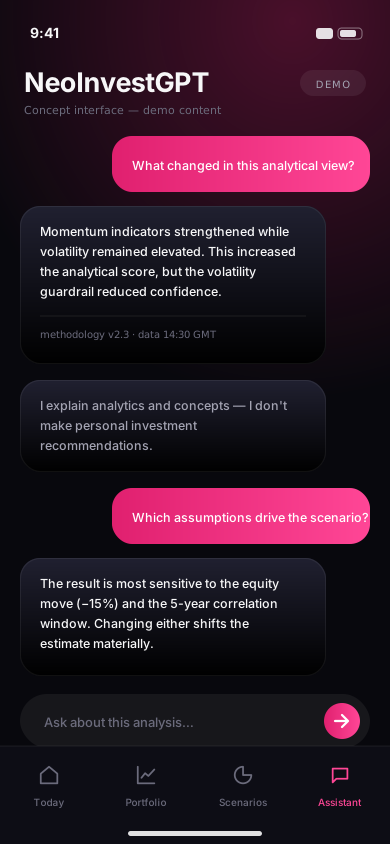
Ask what it means
- Question
- “Why did the forecast for this fund change since yesterday?”
- Service called
- Forecast service — current and previous run
- Probability
- 0.61 → 0.54
- Range
- −3.1% to +7.4% → −4.2% to +6.8%
- Largest input change
- Realised volatility, 20-day
- What it says
- Asked why the forecast changed since yesterday, NeoInvestGPT reads the two forecast-service runs and answers: the probability fell from 0.61 to 0.54, the range widened at the lower end, and the input that moved most was 20-day realised volatility.
- How to read it
- Notice what happened before the words: a NeoInvest service returned structured data, and the language model explained it. The sources, timestamp and limitations travel with the answer.
- What it does not mean
- The language model computed nothing — every figure came from the forecast service. It reports which model inputs changed, never why the market moved, and it does not give personal investment advice.
Where to go from here
The five stages above are the product’s whole shape. Each has its own page with the detail this walk-through deliberately leaves out, and the methodology explains how every output is produced.
That is the product, walked through honestly. If you want it on your phone, ask us to tell you when it launches.
Join the launch waitlist